
The U.S. is a nation on the move, with nearly 15 million Americans moving across the country in 2025.
Some are crossing borders, with the highest number of people making the move since pre-COVID. Around 1 in 5 American adults want to move out of the United States, with a particularly notable increase of 40% among young women looking to leave, often motivated by a better quality of life.
As households face rising living costs and property prices, financial considerations may be driving some people to seek out cheaper zip codes. For many, this would discount states like California, consistently ranked the most expensive state to live in.
Some of the reasons people feel compelled to move to new states are primarily to be closer to family, a new job, or retirement - continuing the surge in “return-home” movers during the pandemic.
Continuing the trend that started in pandemic days, people are prioritizing more rural states because of remote working opportunities, lower cost of living, or a more laid-back lifestyle in comparison to states like New York.
Rural life seems to be a key movement trend in the U.S:
- Since 2020, 75% of growth among 25 to 44 year olds is shown in rural areas or cities with fewer than one million residents
- For the fourth consecutive year, rural counties are seeing a steady influx of out-of-state homebuyers, after a decade of population loss
- Most movers are seeking a better quality of life, with 88% moving to save money and 76% citing the outdoor lifestyle as a primary motivator, often found in more rural areas
With self storage demand driven by national moving trends, we were keen to find out the most and least popular locations for movers in 2026. We analyzed all 50 states across the U.S. to find out where Americans are choosing to stay and leave, and where the demand for self storage may be highest.
Key takeaways:
- South Dakota is the most popular location for movers, with the highest net migration increase at 9.50%
- North Dakota is the least popular location, with more people choosing to leave than stay, and a net migration of -13,000
- The seven most popular states for movers have a significant rural population, with the other three being coastal states, aligning with wider research about Americans wanting to prioritize outdoor lifestyles
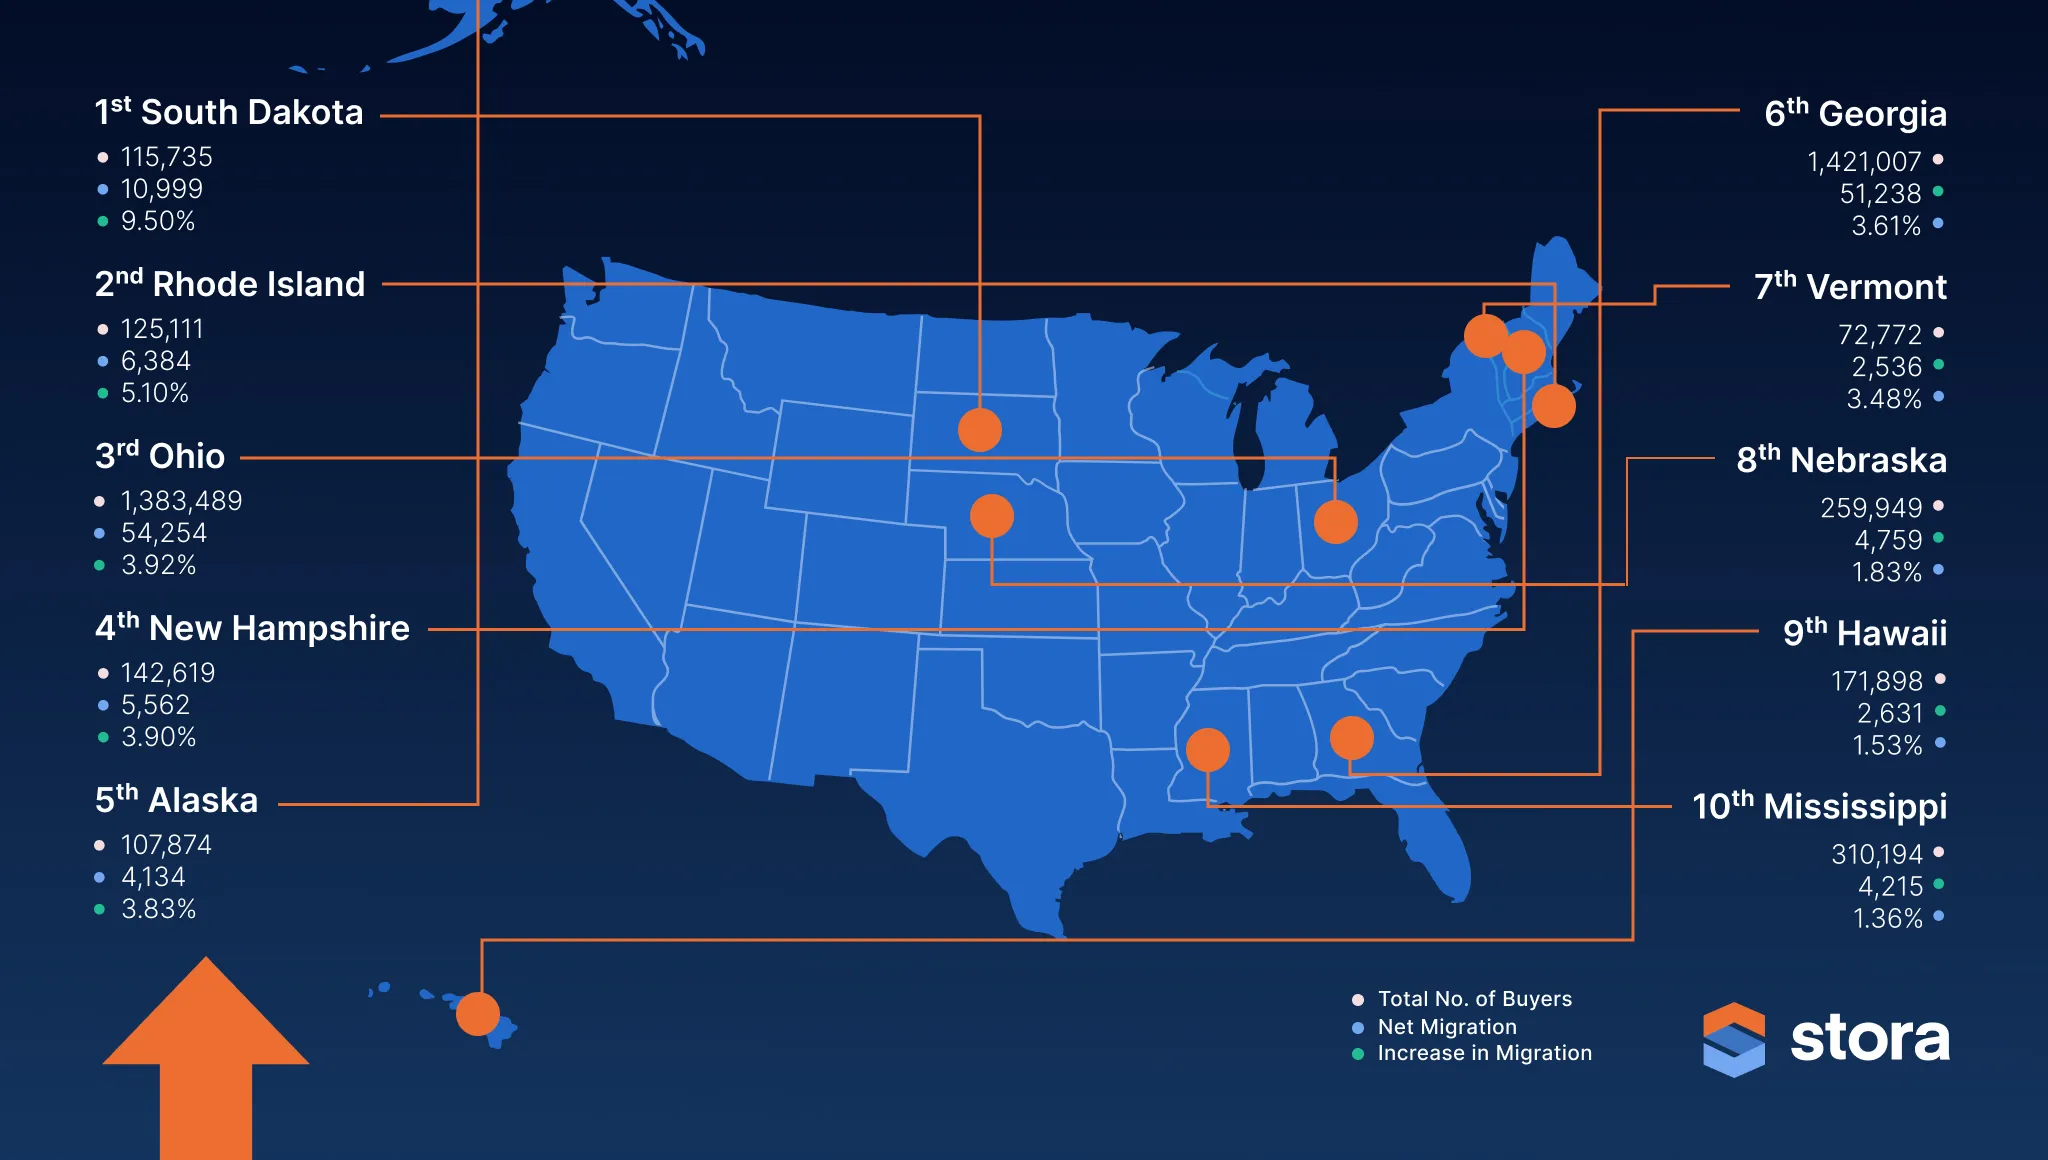
Top 10 popular states for movers
| Rank | State | Total no. of buyers | Net migration | Increase in migration |
|---|---|---|---|---|
| 1 | South Dakota | 115,735 | 10,999 | 9.50% |
| 2 | Rhode Island | 125,111 | 6,384 | 5.10% |
| 3 | Ohio | 1,383,489 | 54,254 | 3.92% |
| 4 | New Hampshire | 142,619 | 5,562 | 3.90% |
| 5 | Alaska | 107,874 | 4,134 | 3.83% |
| 6 | Georgia | 1,421,007 | 51,238 | 3.61% |
| 7 | Vermont | 72,772 | 2,536 | 3.48% |
| 8 | Nebraska | 259,949 | 4,759 | 1.83% |
| 9 | Hawaii | 171,898 | 2,631 | 1.53% |
| 10 | Mississippi | 310,194 | 4,215 | 1.36% |
South Dakota has the highest increase in net migration at 9.50%, with nearly 115,735 people buying a house in the area, and a net migration of 10,999. The Midwestern state, characterized by its rugged landscape, is divided by the Missouri River and is home to the iconic Mount Rushmore.
The average house price in South Dakota is $310,014, which is lower than the national average of $357,275. The average house price in Pierre, the state’s capital, is significantly lower at $286,723, so movers can get more bang for their buck while also having access to more amenities.
Whereas movers looking to move to the Black Hills area, in search of a more peaceful lifestyle, can expect to pay up to or even above $616,116. One major bonus to living in South Dakota is that residents pay no income, estate or inheritance tax, making it one of the most attractive states for business owners, for example.
Rhode Island is the second most popular location to relocate, with a net migration of 6,384 and an increase of 5.10%. Nearly 7,991 people moved from out of state - possibly motivated by its coastal location and access to major cities like Boston and New York. While house prices and monthly mortgage payments are higher at $483,318 and $2,075, respectively, it doesn’t seem to faze movers.
Coming in third is Ohio, with net migration increasing by nearly 4% to 54,254, of which 9,833 are coming from out of state. Possibly due to its lower-than-average house price and monthly mortgage payments at $236,963 and $1,460, respectively.
Alaska and Georgia are also popular relocation hotspots with net migration at 4,134 and 51,238.
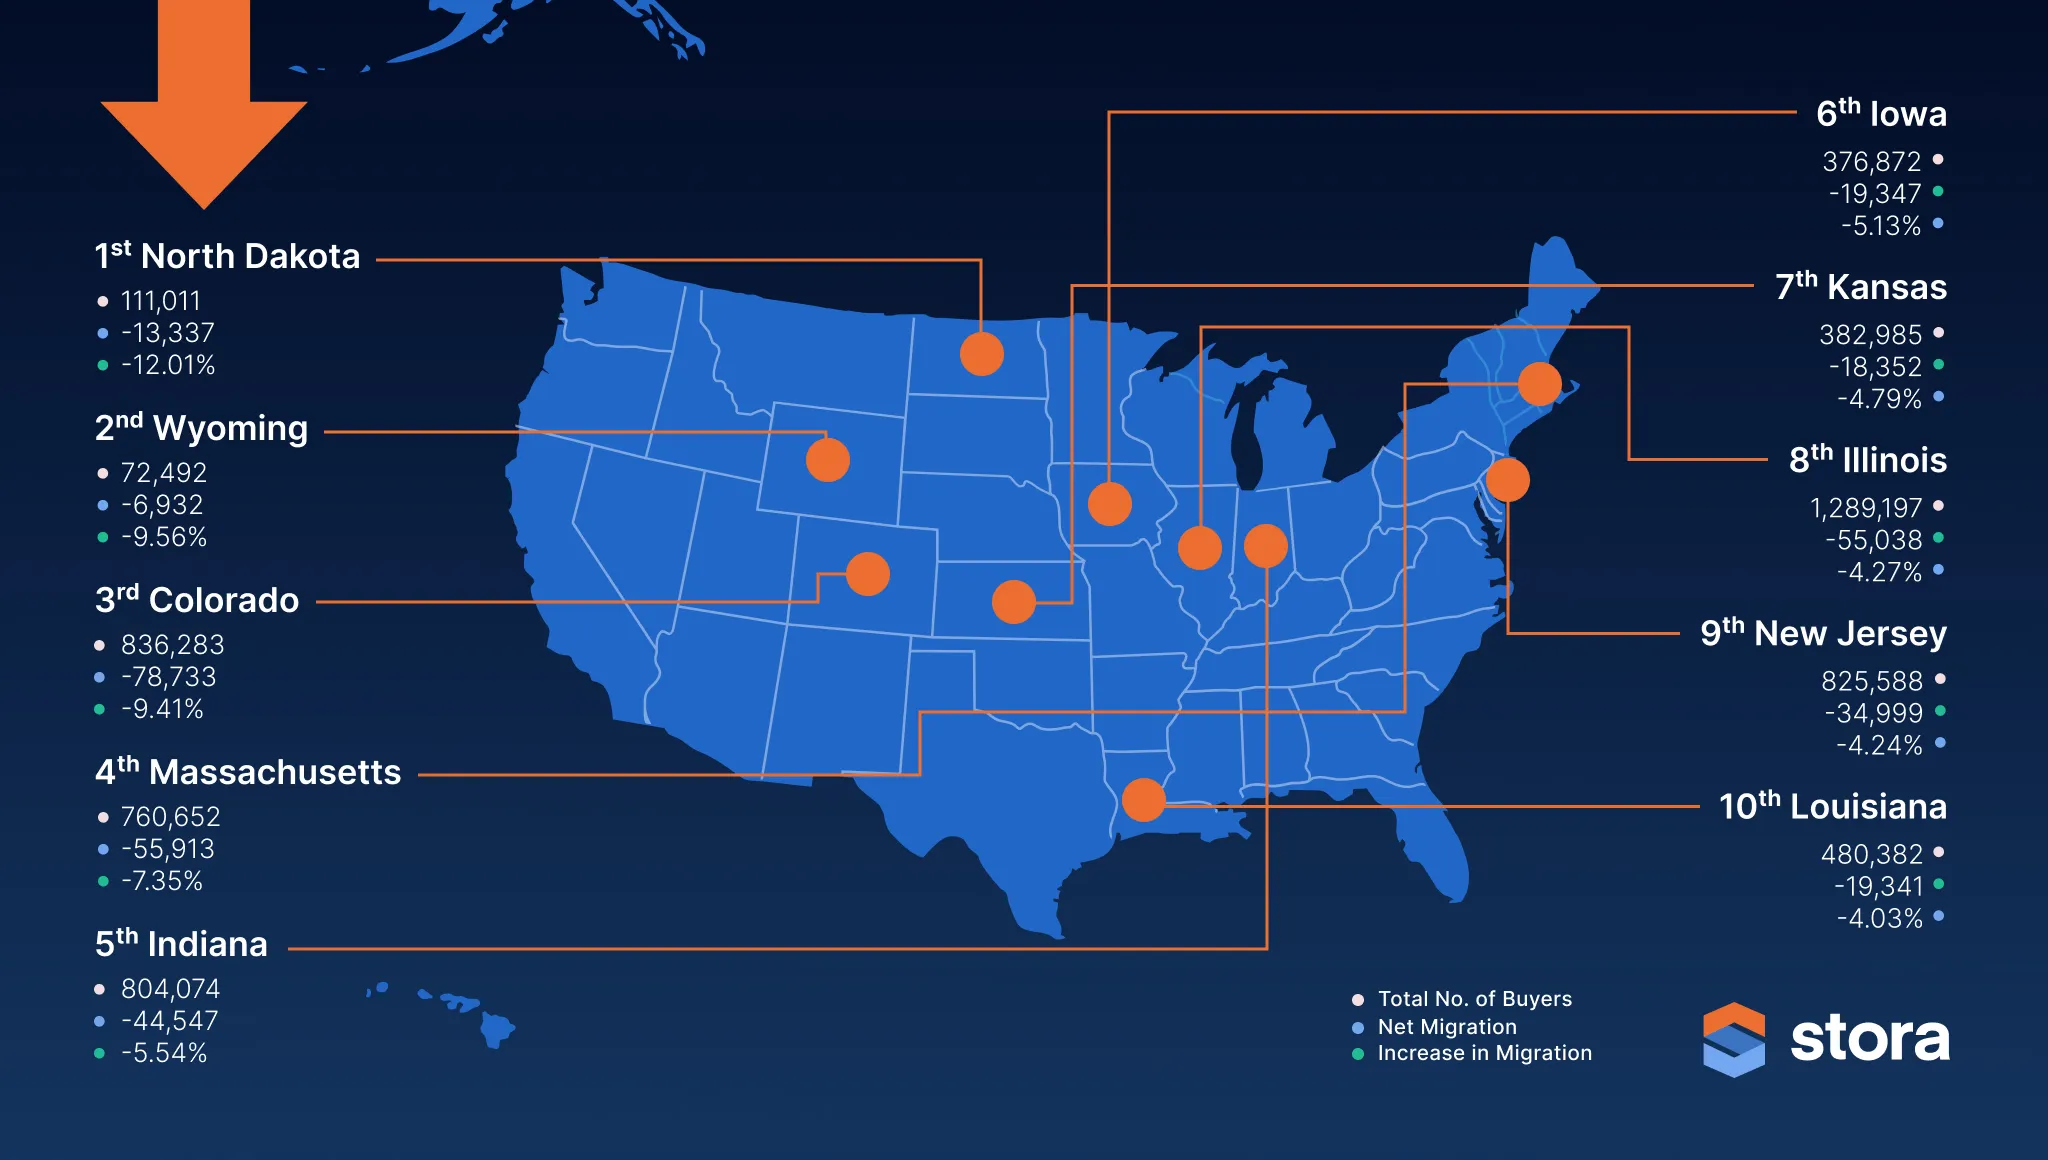
Least popular states for movers
More people are choosing to move out of North Dakota than move in, so migration has dropped by -12.01%, and net migration is negative at almost 13,500 people leaving. Even though the average mortgage payments and house prices are below the national average at $1,671 and $277,556, movers are put off moving there.
The second least desirable state for movers is Wyoming, with a net migration of 7,000. Despite the state’s average house price sitting at the national average ($356,688), people could be moving away in the hopes of more job opportunities.
Thirdly, Colorado is seeing an exodus, with a net migration of -78,733. This follows the trend of people moving away from higher cost-of-living areas, with the average house price and mortgage costing significantly above the national average at $530,756, or $2,330 a month.
| Rank | State | Total no. of buyers | Net migration | Increase in migration |
|---|---|---|---|---|
| 1 | North Dakota | 111,011 | -13,337 | -12.01% |
| 2 | Wyoming | 72,492 | -6,932 | -9.56% |
| 3 | Colorado | 836,283 | -78,733 | -9.41% |
| 4 | Massachusetts | 760,652 | -55,913 | -7.35% |
| 5 | Indiana | 804,074 | -44,547 | -5.54% |
| 6 | Iowa | 376,872 | -19,347 | -5.13% |
| 7 | Kansas | 382,985 | -18,352 | -4.79% |
| 8 | Illinois | 1,289,197 | -55,038 | -4.27% |
| 9 | New Jersey | 825,588 | -34,999 | -4.24% |
| 10 | Louisiana | 480,382 | -19,341 | -4.03% |
Other standout stats:
- Washington has the highest number of out-of-state movers, welcoming over 22,000 new residents in comparison to the previous year
- Despite being a popular moving destination, Hawaii is the most expensive state to live in, with an average house price of $818,553 and mortgage payments of $3,696
- The lowest average mortgage across all of the locations stands at $1,153 in West Virginia
“Our research reveals that despite the number of Americans moving house slowly declining in the past decade, they are still moving far and wide. Naturally, demand for self storage could be higher in these locations, particularly where people are moving from out of state. However, the economy is uncertain and demand can change quickly, so self storage providers need to have the right tools in place to respond to customers quickly and increase bookings.”
*Gavin Shields, CEO at Stora*
Five ways self storage companies can keep up with customer demand
Movement trends can be influenced by societal changes like the Covid-19 pandemic or remote working, but they can also be unpredictable, especially as cost pressures on households mount. In the self storage world, demand tends to follow the 4 D’s: divorce, death, displacement or downsizing.
But whatever the reasons, you need to be prepared to meet customer demand – self storage software can help you to respond quickly by automating processes and improving flexibility for customers.
- Offer flexible booking options: Customers value convenience and speed, so offering a range of easy booking options via online can encourage more bookings.
- Enable dynamic pricing: When units are filling up, the software automatically increases rates, helping you to grow revenue when demand is high and also informing tenants of any rate increases.
- Automate check-ins: Empower customers to check in independently because the software automates the process, while handling contracts, ID checks, communications and access.
- Set up recurring payments: By enabling recurring payments by card or direct debit, ensure payments are convenient and made on time – if there is a late payment, access can be limited automatically until the payment is made.
- Improve visibility: Keep an eye on operations using a smart map, which updates you on the availability and status of units in real-time.
Methodology
Stora analyzed data from 50 U.S. states and examined where U.S. citizens are choosing to move. Using Census data, we analyzed the number of house moves for each state for the past two years to reveal the percentage increase in net migration.
In addition, we analyzed Zillow data to determine the average property cost in each state and used US Federal Housing data to determine average mortgage payments per state to see how much residents could be expected to pay if relocating.